28 June 2015

Building Your Own Low-Cost Equity-Indexed Annuity Or Structured Note


Given the market volatility of the past 15 years, with both the “tech wreck” and the financial crisis, a growing number of consumers are seeking more safety for their investment portfolios, through everything from more proactive risk management strategies, to using products like equity-indexed annuities and structured notes that explicitly provide for "some" upside participation in bull markets, but with downside protection in a bear market.
Yet the reality is that constructing downside protection and a principal guarantee over time doesn’t actually require products like equity-indexed annuities and structured notes. They can actually be constructed with relatively simple combinations of bonds and either stocks or equity index options. In fact, just buying a portfolio of bonds and using the interest to buy at-the-money call options is sufficient to produce a partial upside participation rate in equities with a downside guarantee!
Unfortunately, though, creating such pairings can be especially difficult in low interest rate environments, as there simply isn’t enough yield to afford very many options contracts, which in turn results in relatively low equity participation rates. Yet given that annuity companies and structured note providers are subject to the same constraints, in the end investors will likely suffer from low returns in such solutions, regardless of which vehicle is used… and in fact may have the greatest upside potential by simply constructing the strategies themselves, and avoiding the internal costs of such products in the first place!

Structured Note Alternatives - Building A 10-Year Downside Guarantee For Stocks Using Government Bonds
Imagine for a moment that you wanted to invest in equities for the next 10 years, but have a guarantee that there would be no downside risk; no matter what, you want to be assured that the portfolio will return at least your principal at the end of the decade.
On the one hand, an investor could simply approach this by recognizing that the probability of having a (nominal) loss in equities over a decade is already a very low probability event, and one whose probability declines even further by diversifying into bonds. The chart below shows the probability of having a cumulative total return that is negative after rolling 5-, 7-, and 10-year periods, for portfolios varying from 100% in stocks in 100% in (intermediate term government) bonds.
Probability of Finishing With A Negative Return Over Rolling 5, 7, and 10-Year Portfolios At Varying Equity Exposures
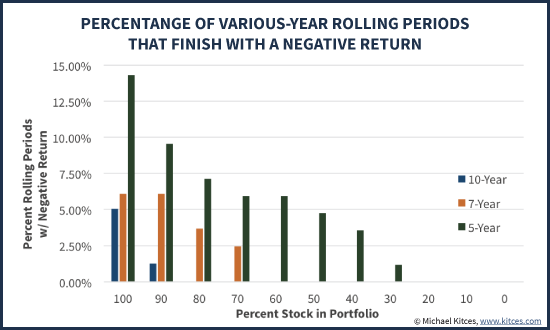
Not surprisingly, while the odds of a negative return are fairly low across the board, and the odds decline further as the time horizon lengthens and the portfolio becomes more conservative. While many portfolios may still be negative after 5 years, historically over a 7-year time period, a portfolio with 60%-or-less in stocks has never had a negative cumulative return. Over a 10-year time horizon, as long as bond exposure is at least 20% (i.e., equity exposure is down to 80%), a negative cumulative return has never occurred over such a "long" time horizon; in other words, to the extent that equities were down at all, with as little as 20% in bonds the bond return was enough to fully offset any losses. 
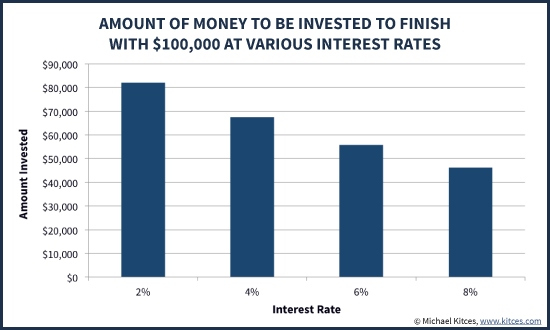
Of course, while equities have historically always recovered enough that 20% in bonds is "enough" over a 10-year time horizon, in the extreme an investor could actually guarantee that the portfolio will never have a negative return, simply by buying enough 10-year government bonds to ensure that just holding until maturity alone will replenish the entire principal. In such a scenario, even if the stock market in the aggregate went to zero, the bonds alone would still mature with sufficient value to replenish the original principal. Of course, the amount it takes in bonds to provide for that principal replacement depends on the (10-year) bond yield in the first place; the higher the yield, the less it takes in bonds to replace the principal down the road (and the more than can be invested into equities), while in today’s environment with lower yields, it takes far more, as shown in the chart below. (Chart assumes the investor simply buys 10-year zero-coupon Treasury STRIPS at the specified rate.)
Required Principal In Bonds To Recover Back To $100,000 Assuming Various Interest Rate Yields
Once Treasuries are in place to secure the “floor”, the investor would simply put the rest of his/her funds into equities… at a 2% interest rate, this would require about 82% of the portfolio in bonds, and the remaining 18% in equities. As noted earlier, in this scenario the stocks could go all the way to zero, and the investor would still be protected because the bonds alone would mature at par to replace the original ($100,000) portfolio value.
In fact, even if equities were merely flat for the decade, the investor would still end out with 100% of the original principal (from bonds), plus 100% of the original investment in equities, resulting in a final value up 18% cumulatively, for a modest positive total return of about 1.67%/year. Even if equities are down 20%, there will still be a positive return for the total portfolio of about 1.35%/year! And of course if equities are up, the investor just makes even more on top of the bond return. Either way, the principal guarantee stays intact no matter what.
Ending Portfolio Values With Bond Principal Guarantee Plus Equity Upside Participation


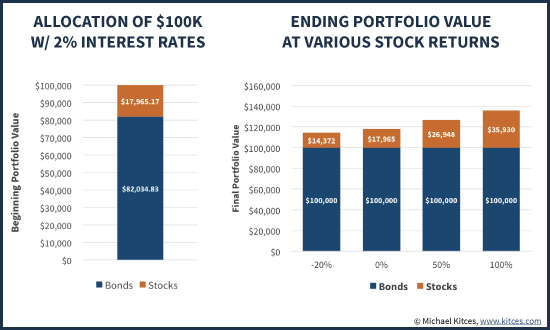
Of course, because a large portion of the funds were occupied by the bond allocation – especially given today’s low interest rates – the investor only gets a “modest” participation in the total upside of equities. Even in the scenario where the market grows by 100% cumulatively in a decade (an average annual growth rate of about 7% for the stocks), the overall portfolio is only up at a 3.1% average annual compound growth rate. In other words, the investor only participated in about 44% of the total upside in this bull market scenario. But then again, the investor got that upside participation with no downside risk at all, as principal itself was entirely secured by just the bonds alone. Given current Treasury yields, any investor could theoretically do this today.
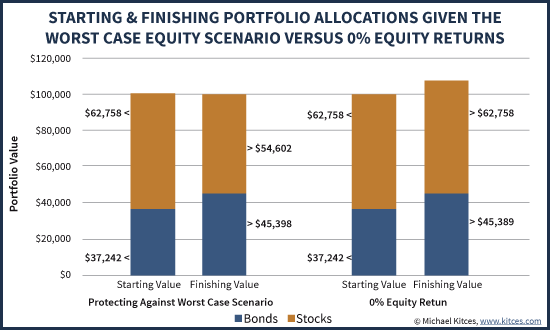
Notably, one of the caveats to the strategy of pairing Treasuries-to-replace-principal with a stock allocation is that even if stocks finish flat, the portfolio will technically be up. In order to achieve a scenario where the total return is zero when stocks are flat, the investor could choose to allocate less to bonds and more to stocks - for instance, putting in enough that even if stocks do have their worst decade ever, the remaining value in equities - plus the value of the bonds - would be enough to replace/secure the original $100,000 portfolio value. And if the equities "merely" finished flat (at a 0% return), the portfolio again would be up at least a little.
Pairing Equities And Bonds To Create Portfolio Protection
Pairing Treasury Bonds With Equity Index Options For A More Efficient Downside Guarantee

Given the challenges of cleanly aligning a guaranteed floor and equity upside by pairing together stocks and bonds directly, an alternative way to structure the transaction is to use bonds and equity index options, as the latter provide for a more effective “alignment” of upside and floor guarantee.
For instance, in the simplest scenario, an investor might simply buy a series of 10-year Treasury bonds, and use the annual bond interest to buy a series of 1-year at-the-money call options for the desired equity index (e.g., the S&P 500). At worst, if the market doesn’t go up for 10 years, the options will expire worthless every year, but the bonds remain to mature at par at the end of the decade, returning the target principal amount. And any year the options expire inthe money, the investor participates in (at least some of) the upside.
Pairing Treasury Bonds With Equity Index Options
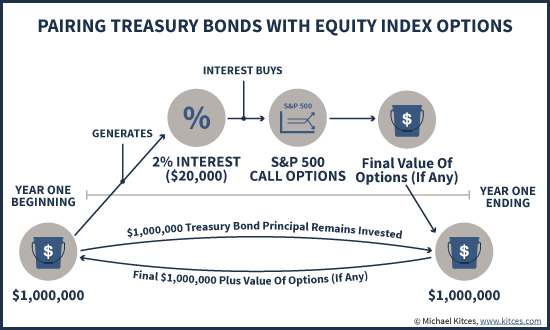
Of course, at today’s low interest rates, there’s not a lot of interest available to invest into those options. With the 10-year Treasury yielding roughly 2%, and an at-the-money call option on SPY available for $12.50 for a strike price of $210 (as of when the S&P 500 was at 2,100), an investor with a $1,000,000 portfolio could buy roughly 16 options contracts (with the 2% x $1,000,000 principal = $20,000/year of interest). Of course, it would actually take about 48 call options at a strike price of $210 to get full equity participation on a $1,000,000 account, so buying “just” 16 options contracts would give the investor an upside equity participation rate of roughly 33%.
Purchasing Equity Index Options With Bond Interest For A 33% Participation Rate
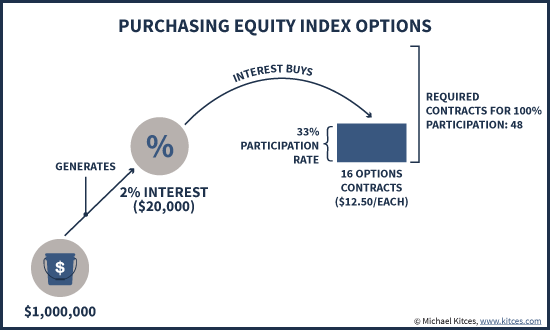
In other words, given what today’s interest rates will bear out in buying call options, the investor effectively gets a 33% participation in the upside price movement of the S&P 500 (note: price changes only, as options don’t pay dividends!), with “no downside”, since at worst the options merely expire worthless at the end of the year and the investor buys new options again next year while bond principal remains intact (to mature at par at the end).
Since options would be purchased one year at a time in this example, each year the starting point for equity participation will “reset” to the then-current level of the index, and the participation rate itself will fluctuate up and down with then-current pricing of options (which may be more or less expensive, depending on changes in volatility along the way).
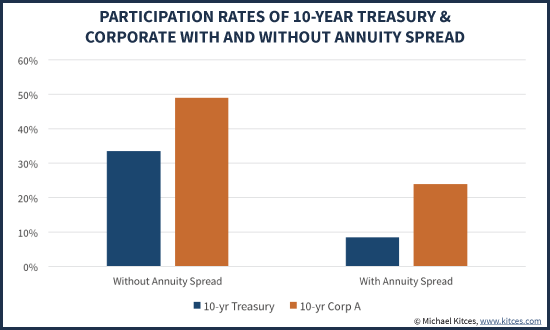
Of course, to the extent that the investor is comfortable taking a little more risk, the participation rate can be improved further. For instance, with 10-year A-rated corporate bonds (slightly greater risk of default than Treasuries) yielding approximately 2.9%, using that interest buys enough options contracts to produce a first-year participation rate of 49% instead of “just” 33%.
On the other hand, the caveat is that in the context of an equity-indexed annuity (or a structured note that functions in a similar manner), participation rates will be lower, as the insurance company needs an opportunity to make money as well, as a for-profit entity (not to mention recovering its costs of overhead and distribution). With an equity-indexed annuity, this is accomplished through an interest rate spread – in other words, while the insurance company might invest in bonds that pay 2%, it may keep 1.5% of that interest yield to cover everything from overhead to profit margins to the commissions paid to the selling agent, with only the remaining 0.5% yield going into options. Given today’s low interest rates, though, cutting out a 1.5% interest rate spread has a dramatic impact, reducing the participation rate to only 8% using 10-year Treasuries and 24% with a 10-year A-rated corporate bond.
Equity Upside Participation Rates With Treasury Or Corporate Bonds With And Without Annuity Company Earning Interest Rate Spread
Because the participation rate is driven by the number of options contracts purchased, and the free cash flow to purchase those options is derived from bond interest, the overall level of interest rates turns out to be a key factor in the potential participation rate of an equity-upside-with-downside-protection strategy. If/when/as interest rates rise, so too will available participation rates, either for equity-indexed annuities, structured notes, or for investors and advisors who wish to construct their own using bonds and options.
On the other hand, as long as interest rates stay low, both insurance companies and investors may feel forced to find other means to boost participation rates, either through strategies to increase the yield and available dollars to buy options, or to manage the (net) cost of options.
For instance, an investor might own different (e.g., lesser quality) bonds to stretch for greater yield, or move into other segments of the bond market that might otherwise generate better cash flows. The more the bond cash flows, the more money there is to buy options, and the greater the upside participation rate. In the context of equity-indexed annuities, insurance companies often use their size and scale to negotiate for better pricing on bond deals to maximize their yield. Investors can also boost their participation rates by giving up a bit on their guarantees in the first place; for instance, if guaranteeing “just” 90% of the principal is sufficient, the investor can put less money in bonds, which frees up more capital to invest over time towards options instead, resulting in more equity upside participation.
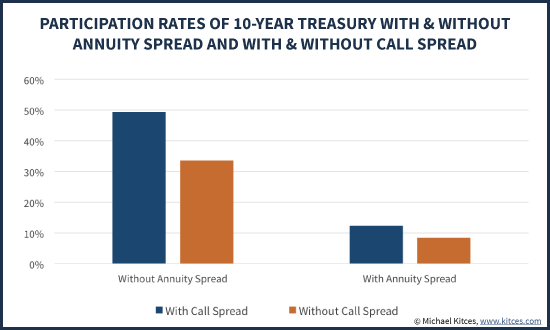
Alternatively, the net cost of options can also be reduced with call spreads, like buying an at-the-money option but selling an out-of-the-money call option at a higher strike price. The net result puts an effective cap on the maximum appreciation, but increases the participation rate along with it. For instance, a call option for SPY at a strike price of 230 costs approximately $4.00 (at the time of this writing when the S&P 500 is around 2,100), which would reduce the net cost of an at-the-money call option from $12.50 to only $8.50. In turn, this would allow a larger number of options to be purchased, but the maximum appreciation for the year would be limited to only about 9.5% (the gain from 210 to 230 on the SPY, corresponding to 2,100 to 2,300 on the S&P 500). Of course, when purchased from an equity-indexed annuity company (or a structured note) that must charge an annuity interest rate spread, participation rates will still be compressed slightly.
Equity Upside Participation Rates Using Treasury Bonds With Either Unlimited Upside Participation Or A 9.5% Equity Cap
Amplifying Participation Rates In A Low Yield World With Call Spread Caps And Monthly Averaging

Notably, in the context of equity-indexed annuities in particular, insurance companies have also sought to increase participation rates by shifting from annual point-to-point strategies (i.e., participation in the one-year price return of an index like the S&P 500) to “monthly averaging” strategies instead. With monthly averaging, the investor’s return is calculated by taking theaverage price of the index throughout the year, comparing it to the original, and calculating the appreciation accordingly. Thus, for instance, if the market went up 12% for the year by rising 1% each month, the S&P 500 would grow from 2,100 to approximately 2,350, and the averageprice for the year would be about 2,225. Since 2,225 is a 6% increase over the starting level of 2,100, the monthly averaging formula would return 6%, then further adjusted by the participation rate (so if the participation rate was 75%, the final return would be 6% x 75% = 4.5%, even though the market was up 12% overall).
Ultimately, monthly averaging formulas will (on average) produce lower returns in bull markets than point-to-point structures since markets average positive returns (e.g., a normal point-to-point one-year option in this example would have applied the participation rate to 12% upside instead of only 6%). However, because the monthly averaging options contracts are generally cheaper (for this same reason about their expected returns), annuities based on them will tend to have higher participation rates; in the end, given the different combinations of upside potential and participation rates in that upside, investors may not actually see substantively different returns either way (e.g., 75% participation on 6% appreciation in a monthly average formula is similar to getting 40% participation on the 12% upside in a point-to-point formula). In many cases, which is better will simply depend on the exact path the market takes for the year - at least, if all else is held equal (though that is not always the case).
While monthly averaging options in particular generally aren’t available to consumers (as they’re privately negotiated derivatives for insurance companies that aren’t traded on public exchanges for consumers to purchase), the remaining strategies of investing for greater bond yields, accepting diminished principal guarantees in exchange for more upside, and using call option spreads to get greater participation but with an upside cap, are all feasible for individual investors. In other words, advisors and their clients really can build their own equity-indexed annuity or structured note solutions, but without the annuity or structured note itself (though notably, this "do-it-yourself" solution also loses out on the tax-deferral treatment of annuities, which may be relevant for some clients!).
Of course, the irony of building “your own” principal guarantee is that it does mean trading in options, and watching – at least in down years – the value of those options potentially going all the way to zero. While that -100% return will by definition only be for a very small percentage of the portfolio, the fact remains that for many investors, it may actually be morepsychologically comforting to not see how the sausage is made and just view a single account balance with a floor (as occurs with equity-indexed annuities and structured notes)… although as noted earlier, the interest rate spread of an annuity (or structured note) can significantly undermine the potential upside of such “packaged” floor-with-upside investment strategies in low yield environments, so that psychological comfort has a potentially significant cost trade-off!

23 June 2015

Why a financial guide is necessary

An answer to a young professional as to why a financial coach / consultant is required

Why Me??

Do not think of the current period when you are investing. Think 5, 10 or 20 years into the future

A financial trainer / advisor will help you learn about investing and in a little time you could talk to him like an equal. Rather, he could lead you to so much of learning that you may start wondering whether you need him at all. 

No I will never be rendered useless, but will help you realize the potential emotional mistakes that can be avoided. If you do realise quickly it will be my pleasure to tell you that investing is about 80% emotion and 20% logic. If I can even tweak it a little towards 50% each, I would have done a great job.

If I can make you understand why you need an Investment Philosophy Statement and an Investment Diary - xl sheet / balance sheet I would have done my job.

If I can get you to write a short note on every investment that you make, I would have done my job.

If I can convince you that trying hard does not improve returns, I would have done my job.

If I can convince you that you need not jump from branch to branch because you saw a tiger, hey monkey, I would have saved your life!!  :)

If I can convince you that equity investing - shares / mutual funds  is not a game, I would have done my job.. Then one day you will want to invest your brother's / sister's/ son's money. Your mother’s brother’s money! People you love, but are unable to guide. A guide will teach them and you how. Not to make you an adviser but to talk to your family in a far more caring and sensible way beneficial to them. 

Or guide your children through the investing process. Not that YOU cannot, but they may listen to me better. It helps. 

A big distributor who I will not name says that SIP will make you rich in 3 - 5 years.!!! Misguiding all. That;s what coaches are for- to prevent you falling for crap. Crap like - insurance with investment is good!!!

You will want to consolidate all your investments. My aim to to get my mentees to simplify their financial lives and take away the drudgery.  

No. I cannot be replaced by an algorithm. Not by a website. Not by an investor group. No I am not fungible. I can assure you, at the end of the journey you would have found me worth every penny. No I cannot really offer you a Moneyback guarantee, but I can make a solid attempt to keep the relationship on till the end of life.

My life of course kiddo, you are way to young. 

Follow me on twitter

Hat tip Subra !

18 June 2015

Some thoughts on making mutual funds work for you

"By mapping goals, your investments would be well-directed" from BL
Mutual funds are for everyone. Investing in schemes can help you achieve your financial goals. Here are some factors to note to ensure that you gain the most from your investments.
Identify needs and goals


Ask yourself the question — When do I need money and for what purpose? List down your financial goals and when they are likely to materialise (daughter’s higher education after six years, purchase of a house after 10 years, for example), and how much money you will need for the same. The answer will help you arrive at the time frame for your investment — short term, medium term or long term.
Match your investments to the time horizon of your goals. For your long-term goals such as retirement or children’s education, go in for equity funds which, even though volatile in the short term, are likely to give you the growth you are looking for. Similarly, for short-term goals, invest in money market or cash funds as they tend to be more stable and predictable.
Understand risk capacity


Will you be comfortable with fluctuations in the value of your investment? Or would you prefer to settle for lower returns, without ups and downs? There is no point in investing your money in equities and spending sleepless nights due to short-term volatility. But at the same time, you need to ensure that your investments provide you returns that will be adequate to meet your long-term goals.

Required rate of return


Your required rate of return depends on your financial goals and the time you have to achieve them.

The later you start, the higher will be your required rate of return. A delay of five years will mean your required rate of returns need to be double the levels than if you start now.
Disciplined investing works


Systematic investing offers investors an easy as well as effective way to participate in equity markets, as it tends to reduce the impact of volatility on investments and also inculcates much needed discipline.

Investors need to keep some key parameters in mind while making their investment decisions.
The key parameters to monitor include: the track record/experience of the fund house; stability of the investment team/investment process; consistent performance across market cycles and relative performance among its peer group (across time periods).
Investments in specified funds would qualify for a tax benefit under Section 80C. Dividends distributed are tax-free in the hands of investors.
Stick to your plan but review it regularly


Before making the investment decision, evaluate how it affects your current asset allocation plan. As time passes by, your life stage changes and so do your needs as well as income.

You need to periodically monitor and review your investment.

16 June 2015

Real estate market no longer a good investment for a household portfolio

This is a post by Uma Shashikant in the ET. Do read the original post here. A must read and so I am sharing it here.

It is very tough to talk a household out of buying more property. Investing in real estate is a preferred option for most. Even my better-informed friends and colleagues are unable to resist the lure of real estate. For most households, this asset is the largest and most expensive one they would hold on their portfolio. But then, columnists like yours truly are also very determined to point out again and again that one should not overdo this. Why is real estate harmful to a household's portfolio?

There are the usual reasons. Chunky and large, the asset cannot be utilised in small portions. Prices vary by unit, given its specific features, making it a market whose goods are not uniform and therefore expensive to find, evaluate, buy or sell. Transacting costs are high and include interest, brokerage, taxes and duties. Yields are low since the future cash flows in the form of rent extend to perpetuity. To a normal household, buying a house is risky since they operate with very limited information and expertise.

We will discuss the economics of the real estate market this time. What determines supply and demand, and therefore, prices, and how the market adjusts these variables to move towards equilibrium. Modelling the real estate market is somewhat complex due to the presence of two distinct segments of buyers. One set is looking at houses as the space in which they would live in. The other is buying houses as a capital asset or an investment opportunity. The interplay between these segments complicates the housing market and disturbs the equilibrium.

If the buyers of space dominate the markets, the economics is simple and straightforward. Seekers of living space have the choice of paying rent or buying a house, which actually means paying a lump sum upfront, so rents need not be paid in future. Demand for property will go up as more households need space; earn incomes that enable them to pay sustained rents; access affordable credit to buy rather than rent; and use tax concessions to make that large purchase that is otherwise expensive. In this market for living spaces, supply will tune itself to the same factors that influence demand. Since houses are durable, existing stocks will get re-priced, and new stocks will be added based on demand. Valuation and pricing will be the discounted value of future rents.

The complication is that the durability of the housing unit, the high unit cost and the availability of credit and tax concessions creates an opportunity for investors. Even those households that set out to own a space to live in become investors in the property. The changes in the supply of houses and the expected changes in future rent, can modify the valuation of houses, creating a large set of investors and speculators whose actions influence the prices and values.

In a simple user-driven market, demand and supply will determine prices. In a market dominated by investors, cost of funds and supply of property will determine prices. The most important problem in the real estate market in India is that it is dominated by investors who access money that lies outside the system. This is why we have the ironical situation of a large number of unoccupied houses on the one hand and a housing problem for the common household on the other. A dysfunctional market where the supply of houses is tuned to the investor, rather than those that seek spaces to live in.
This brings us to the inveterate optimists who continue to believe that property is the "best" investment. What are the risks? First, the demand is driven by valuation myths (for example, real estate prices in Mumbai can only go up, since it is a tiny island). If renters or buyers of space are only marginal participants, prices no longer reflect this constraint. If more than 50% of Mumbai's population lives in slums, it is a reflection of this imbalance where seekers of space are not buying it, and those that are buying property are simply assuming that someone else will buy at a higher price. Valuation is not based on future cash flows, but on vague assumptions about future price.

Second, demand for property is fuelled by cash, equity and borrowings. The "black" component in real estate purchases makes this market very murky for a household. Property is the preferred place for ill-gotten money to hide. When dominant buyers are also able to meddle with government policy that influences the market, it gets murkier. Large stretches of agricultural land have become immensely more expensive in the last 25 years, simply because the government bought land on behalf of private entities. When "investors" are insiders who are loaded with cash, or are willing to put in their funds or access borrowed funds at low costs, prices respond to the bottomless pot of money that backs up the demand. Investors then see opportunity instead of risk.

Third, supply responds to the investment demand, by focusing on building housing units that appeal to investors. As is quite obvious, the time lag in the response of supply to demand can be a killer in housing markets. The large backlog of unsold houses (over 6 lakh units in metros alone) tells the story of oversupply. Bank credit to housing has since slowed down to single digits; and new investors are tough to find. Measures to tackle the black money are inadequate, but some chipping at the block has begun. It does not take a class in microeconomics to figure what happens to an oversupplied market that is unable to find buyers.

The primary reason why property should not figure as an investment option is this disequilibrium in the property market. The only way it can return to normal is through a deep correction in prices. Investors who brush aside this view are simply assuming that property markets in India will remain skewed and in disequilibrium forever. Brave stance, indeed.

15 June 2015

Top 5 Fundamental Screeners

Om Shree Gurubhyo Namaha

This is very very useful and from here . Do read the original article.


What is stock screening?
Stock screening is a process of filtering stocks based on certain criteria used by investors and traders to screen better stocks from the pack of stocks/sectors. Most Screeners provides ratings, metrics and even rule based scanning which eases out the investing decisions. While taking a investing decision some prefer fundamental screener , some prefer technical screener and the rest prefers using both in a combo to filter out better stocks that met their criteria. This article explores the popular fundamental screeners used widely in Indian markets actively by Indian traders and investors.
Stock screening doesn’t helps a user to predict the movement of the stock in any direction instead it helps in identifying good stocks and the ability to compare a stock with its peers. One was doing screening manually before,but now stock web based screeners helps the users a lot and plays a major role in taking buy/sell decisions.
Generally stock screener has three basic components:
  1. database of companies
  2. set of variables/rules
  3. screening platform to find the companies that satisfies the variables/conditions
Let us see about the top five fundamental stock screeners

1.MoneyWorks4me

MoneyWorks4me provides Value Indicators,Promoters stake and price pointers as type of screeners, Compeer and MoneyWorks4me Filter.Selection is indicated in color codes.They are as follows:
  • Green : Very good
  • Yellow : Somewhat good
  • Red : Not good
Screeners:
Value Indicators – screens stocks with highest & lowest value creation index as Value generators and value destroyers respectively with respect to their capital for the past .
Moneyworks4me value generators
The above figure illustrates Colgate Palmolive, Hindustan Unilever, Castrol India from the large cap are the three which tops the value generators list
Moneyworks4me value destroyers
For Tata power,DLF & JP associates value creation index falls in negative taking past three years into account.
Movers & shakers – screens stocks with respect to the promoters stake in the last quarter compared to the previous quarter as promoters expand(increase in stake) and promoters diminish(decrease in stake)
Moneyworks4me promotors expand
From the above figure let us take vaibhav global as an example, we can find there is 13.15% increase in promotors stake.
Moneyworks4me promotors diminish
In the above figure Balaji Hindustan Sugar met a decline in promotors stake of 21.9% compared to the previous quarter
Price pointers – Screens stocks with respect to their P/Es and price. When stocks have low P/Es and sounds well it is filtered as Healthy & Affordable and if stocks have high P/Es weak it is filtered as Weak & Pricey
Moneyworks4me healthy
For Indian bank P/E ratio ends up with a good and healthy value of 6.61
Moneyworks4me week
The above figure shows stocks which are fundamentally weak & having high P/E ratios.
MoneyWorks4me Filter – Helps to analyse stocks fundamentally in each and every aspect. MoneyWorks4me Filter reveals whether a stock chosen by a user is a right stock,right price and right timing with respect to the 10 year X-ray report.
Moneyworks4me filter
The figure tells us about whether one can choose a particular stock on 10 years report,valuation and research reports with the help of latest financials.

2.Capital Cube

Capital Cube,one of the largest providers of company analysis is the research platform from AnalytixInsights covering more than 40,000 global equities. Analysis includes the following major factors such as fundamental research, corporate actions, earnings quality, dividend quality and equity screening solutions. Capital Cube helps customers to spent less time in tracking down the data and gathering information and valued time on investment potential and opportunities.
The below figure shows how telecommunication stocks are screened with the fundamental analysis score between 10-84 and one month price performance upto 33.06%.
capitalcube screen
Let us make a study on ICICIBANK under BSE exchange
capitalcube summary
Figure above shows the overall summary with chart
capitalcube screens of trends
Trends of ICICI Bank w.r.t to price
capitalcube keyvalues
Characteristics and Price history

3.Screener.in

Screener.in is a stock analysis and a screening tool to see all the information of a company on a single and customizable page. The Bull Cartel, Growth Stocks, Loss to Profit Companies, Magic Formula, Piotroski Scan and Highest Dividend Yield are the featured screens given by screener.in. Apart from the featured screens users can design their own screens based on their standard and strategy. Email alerts are also enabled for the customer screens. If customer’s criteria is met they will get an Email.
The Bull Cartel : screens stocks of best quarterly results. The figure reveals ICICI bank performed well in the recent quarter.
screener bull cartel
Growth Stocks : Helps to find stocks with high growth potential and strong financials
screener growth stocks
From the figure one can choose BN Rathi securities, as it shows a growth factor of 9 & P/E ratio of 4.92
Loss and Profit Companies : Helps to screen companies which showed a good turnover and quarterly results from loss to profit. Ashok Alco-chemicals produced 927.08% of YOY quarterly profit growth
screener loss profit
Magic Formula : Helps to screen stocks which beats the market’s average annual returns. Applying magic formula, Sagar cements earnings yield has been declared as 50.41%.
screener magic formula
Piotroski Scan : Piotroski score between 0-9 will be decided from the nine criteria to determine the company’s financial position. A stock is said to be a best stock if it holds piotroski score of 9. Piotroski score is determined under the three major categories:
  • Profitability
  • Leverage,Liquidity and source of funds
  • Operating Efficiency
Piotroski score for Tata Communication Limites, Zenith Exports & Siyaram’s Silk Mills Limited are 9 which in turn reveals that these are best stocks with strong financial positions
screener piotroski scan
Highest Dividend Yield : Helps to screen stocks based on dividend paid out on highest yield. Indiabulls Ventures Limited tops the Highest dividend yield shares with 10.22% dividend yield.
screener highest dividend yields

4.Stockflare

Stockflare helps to find the stocks for investor’s portfolio. Through hundreds of metrics for more than 40,000 stocks globally and every stock is rated. Stocks are rated on certain factors such as Market Value, investing style, Business Metrics and valuation. Checkout our review on stockflare fundamental screener
Market Value : Here stocks are rated as market value high to low, low to high, Price value high to low and viceversa as well star rating.
Investment Style : Investment style based on factors – good value,high growth, high quality, market sentiment, momentum, 52 week high-low.
Business metrics : Business metrics are decided by the factors such as company’s capitalization, profit, Growth, dividends paid to shareholders, cash & investments.
Valuatoin : Valuation is estimated with the factors like PE Ratio under 10x, Dividend yield over 4x, trading below book value, less than 1x sales, less than 7x operating profit.
stockflare 5 star stocks
The above figure shows the five star rated Indian stocks
stockflare positive momentum
Stocks which possess positive momentum i.e. trading above 10 day average are shown in the above figure
Let us see how Tata Power has been rated
stick flare tata
stockflare 1
stock 2

5.Equity Boss

Equity Boss is an investment discovery and analysis platform that makes investment decision simple for investors.Equity Boss gives grades after using a accurate indicator to know whether the stock outperforms the market consistently, backtested for years and proved to be good correlation, quantitative comparison among financials.
Stock ratings or EB Grades:
  • Excellent – potential outperformer
  • Good – market performers
  • Poor – underperformers
Let us see Motherson sumi’s performance according to the Equity Boss in the following figures:
equityboss fundamentals
Equity Boss grade for Motherson Sumi
Equity Boss gives excellent for Motherson sumi after some actionable insights, backtesting and powerful screening.
equityboss momentum
Momentum of Motherson Sumi
The figure shows motherson sumi is in bullish mode according to EMA and also the price zone
equityboss complaints
Shari’ah of Motherson Sumi
equityboss seasonal odds
Seasonal Returns
equityboss financials
Annual Returns
From the above figure Motherson sumi made a YOY net profit of 143.35% for the financial year Mar 2014.
Hope you get useful insights about the popular fundamental screeners for Indian Markets. Next time do catch you up with interesting insights.